See the revenue, cost and profit behind every decision.
AI Insights turns the data you already have into dashboards your decision makers can act on. Ask in plain language, drill from the headline number to the record behind it, and shape every report around your business. On your own data, on your own servers.
Certified, patented, enterprise-grade
How it works
From raw data to a decision
Your data goes in once. After that, anyone can ask, see and share, powerful AI powered insights for crucial business decisions.
Connect your data
It reads from the sources you already run, relational or not, spreadsheets, web services and Big Data.

Ask or explore
Type a question in plain language, or drag and drop to explore. There is no query language to learn.
See it on a dashboard
The answer lands as a chart or a live dashboard, the numbers your decision makers watch.
Drill to the detail
Open any figure to the level below it, right down to the single record behind the number.
Share and schedule
Send a report, or set it to arrive in the right inboxes on a schedule you choose.
How it works
Five ways to turn your data into decisions
The whole of TimeBound, in five surfaces your business users work in directly. Ask, report, schedule, explore and forecast, all on the same data.

Natural language query (NLQ)
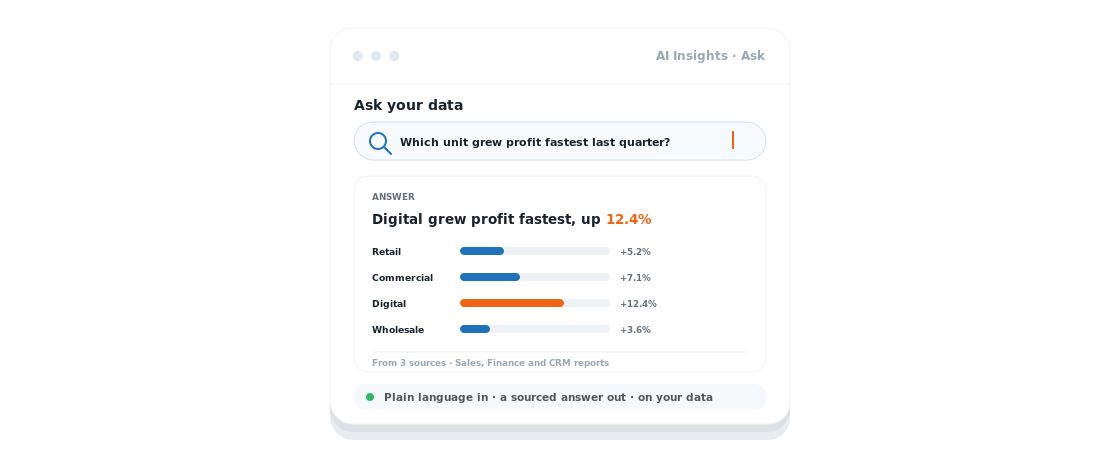
Ask your data in plain language.
Conversational questions
A data-backed response in seconds.
No SQL (database queries) to learn
It turns what you mean into a query.
Answers you can act on with confidence.
Output you can read and understand.
Dashboards & reports
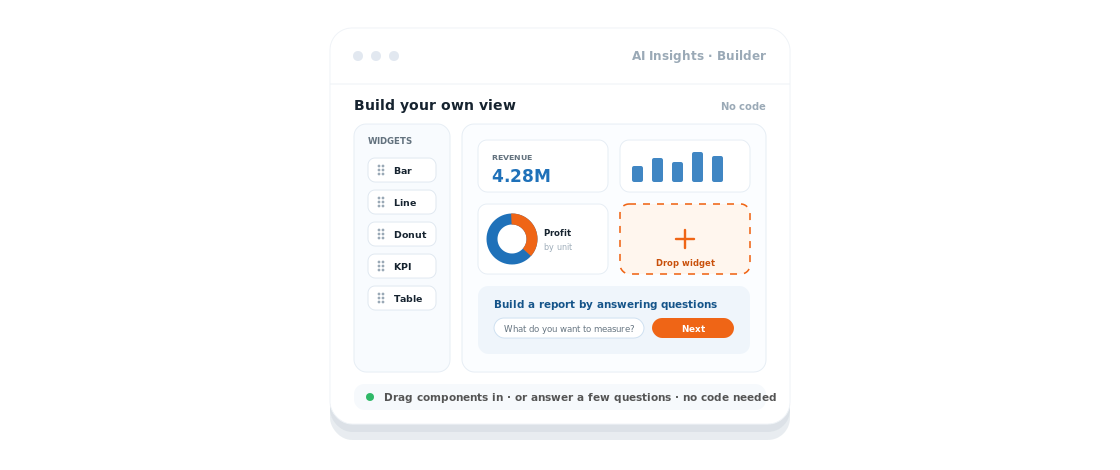
Build the view your team watches.
Charts and reports in a clear layout.
Track live performance as it moves.
Navigate and filter with a click.
Watch trends, anomalies and KPIs.
Shape each report around your business.
Open any figure to the record behind it.
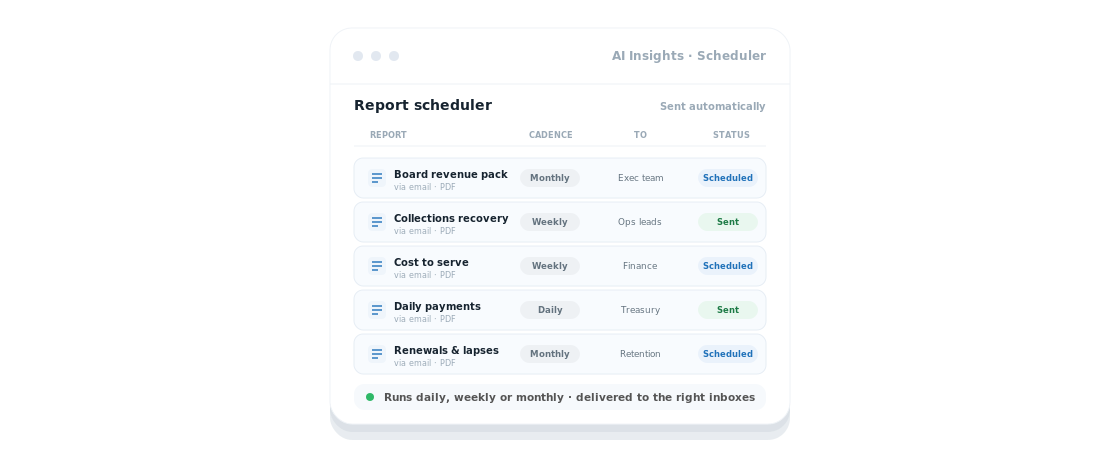
Report scheduler
Send the right report, on its own.
Generated without manual work.
Reports reach people on schedule.
Sent through your email systems.
Set the cadence you need.
No manual steps to get wrong.
Free your team from repeat reporting.
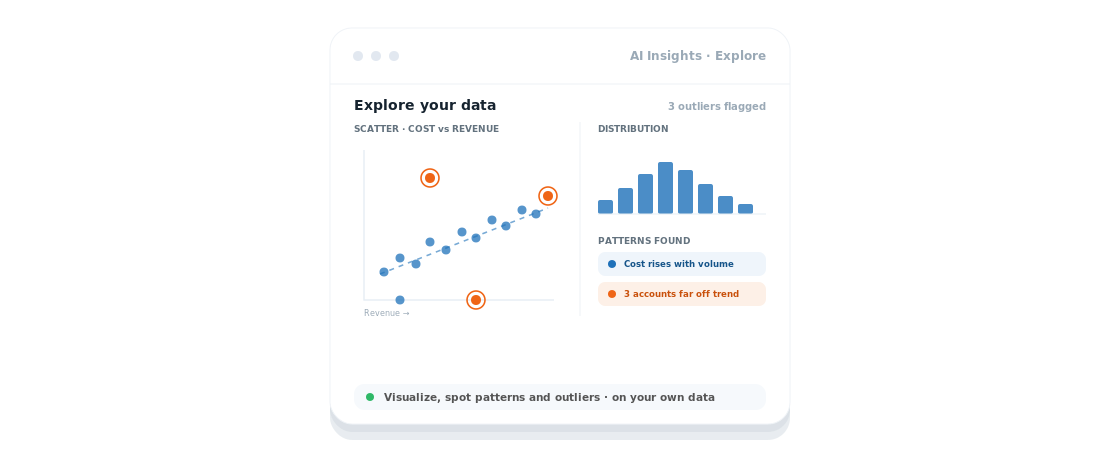
Exploratory data analysis (EDA)
Find what stands out in your data.
Explore datasets with charts and graphs.
Surface trends and hidden relationships.
Spot anomalies and unusual points fast.
Understand the shape of your data.
Find missing or inconsistent values.
Ground the next move in evidence.
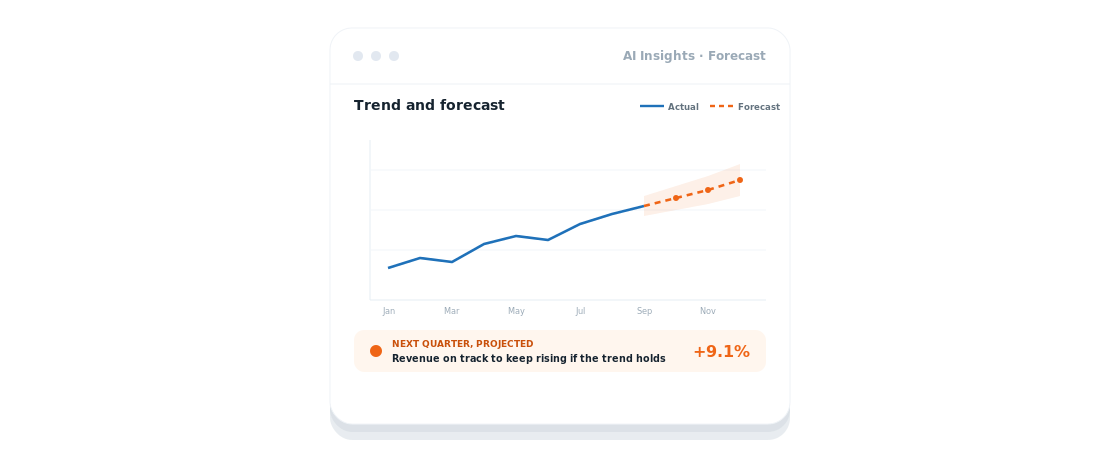
Forecasting
Decide with the next quarter in view.
Project the future from your history.
Plan operations and resources ahead.
See risks and openings early.
Analytics models for precise forecasts.
Right-size stock and resources.
Act sooner, run leaner, earn more.
The platform
Everything a business user needs,
no code required.
Pick what to measure, arrange it the way you think, and keep IT for the plumbing, not the reports.
No code, by design
Build a report by answering a few questions. No formulas, no query language.
Drag-and-drop building
Assemble a dashboard by dragging components onto the page.

Bring your own data
Upload a spreadsheet and combine it with the rest,
without a data team.
Ready-built metrics
Start from metrics already modelled for your industry, not a blank page.

Governance and access
A workflow engine controls who can open, edit, schedule and share.
On every device
Same dashboards on a tablet or phone, so the numbers travel with you.
Why it matters
What it changes for the business
The dashboard is the surface. What it buys you is speed, trust, and control over where the data sits.
Decide in minutes, not report cycles
The question you have today gets an answer today, not after the next reporting run.
Free your analysts and IT
Business users self-serve the routine reports, so scarce technical time goes to the harder problems.
One source of truth
Everyone works from the same modelled numbers, so meetings argue about the decision, not the data.

Keep it on your own servers
Deploy in your own cloud or on-premise, so sensitive figures never leave your walls.
Use cases
Where a dashboard earns its place
Point it at the decisions where the cost of guessing is highest, then widen from there.
Banking
Collections recovery
Track promise-to-pay, roll-rates and recovery by bucket, in one view.
Banking
Payments & transactions
See volumes, declines and fees move, and act before month-end.
Insurance
Renewals & retention
Watch renewal rates and lapses by product, and step in on time.
Insurance
Claims cost & leakage
Follow claim cost, cycle time and leakage down to the claim.
Fin. services
Portfolio & risk
Read exposure, delinquency and provisioning against your limits.
Contact center
Cost to serve
Tie handle time, volume and channel mix to what each contact costs.
Sales
Campaign & pipeline ROI
See which campaigns turn into revenue and which only turn into activity.
Healthcare
Throughput & access
Track appointments, wait times and no-shows across sites.
HR
Workforce & absence
Read headcount, attrition and absence, ready to explain to the board.
Finance
Executive P&L rollup
Bring revenue, cost and profit into one board-ready picture.
How we're different
What sets AI Insights apart
The things a business buyer weighs, who can actually use it, how fast it delivers, and where the data sits, decided in your favour.
Already have reports inside your HRMS, collection system or CRM? Each of those sees one application. AI Insights reads across all of them, so you can ask a question that spans systems and get one answer. Stated as facts about CanString; the right-hand column describes the common pattern across the category, not any single provider.
Five platforms. One system.
Voice agents make and take the calls. Every other platform reads from the same documents, scores the same conversations, and reports on the same numbers. Nothing to sync. Nothing to duplicate.
AI Voice Agents
Answers and makes every call, using your own documents as the script.
Explore platformOmnichannel Campaigns
Runs the same conversation across voice, SMS and email, from one place.
Explore platformAI Analyzer
Scores every call your agents take, against your own rubric, automatically.
Explore platformAI Insights & BI
Turns call volume, containment and sentiment into one dashboard you can question in plain English.
Explore platformAI Knowledge Assistant
Holds the documents every other platform answers from.
Explore platformQuestions
Answers before you ask
See it on your own calls
Bring us ten of your calls.
We'll show you the analyzed result.
We'll run CanString against your own conversations, audit them end to end, and
show you exactly what full coverage looks like for your team.